MAF702 Financial Markets
Instructions:
Question 1 (Marks 10)
You are making a plan to buy a house after 10 years from today. You are looking for an investment package which will at least produce $750,000.00 at the end of 10th year. There are 2 companies in the market (Company X and Y). Both of the companies are offering you an investment package for your purpose. The details of both of the packages are given below:
Company X offers a package of two investment opportunities X1 and X2 together. If you accept you will have to make separate investments in X1 for 10 years and X2 for 4 years. The investment in X1 should start now, however the investment in X2 will start in 7th year from now. Both investment (X1 and X2) will mature at the same time at the end of 10th year. The details of X1 and X2 investment plans are as follows:
Investment X1: The required investment at present is $65,000.00 which will go through 4 following phases (phase 1 to 4) in next 10 years. At the end of phase 1, 2 and 3 the entire fund will automatically be rolled over to the next phase for re- investment. The investment will mature at the end of phase 4. The 4 phases are as follows:
Phase 1: During first 1 years the investment will earn 12% return p.a. as per simple interest method, then roll over to phase 2;
Phase 2: In the following 2 years the investment will earn 9% return p.a. compounding daily, then roll over to phase 3;
Phase 3: In the following 3 years the investment will earn 14% return p.a. compounding monthly, then roll over to phase 4;
Phase 4: The final 4 years of the investment will earn 4% return p.a. compounding quarterly. The investment matures at the end of phase 4.
Investment X2: This investment is spread over 4 years. It will commence in the 7th year of the 10 year investment plan, so the timing of this 4 years will match the last 4 years of the 10 years of investment plan of X1. X2 requires an investment of $4100.00 at the end of each fortnight for 4 years, which will earn 16% p.a. return compounding fortnightly.
Both
investments in X1 and X2 will mature at the end of the 10th year.
How much, in total, will you accumulate from both investment opportunities at
the end of 10th year?
Company Y offers a package of two investment opportunities Y1 and Y2 together. You will have to make separate investments in Y1 for 10 years and Y2 for 3 years. The investment in Y1 should start now, however the investment in Y2 will start in 8th year from now. Both investment (Y1 and Y2) will mature at the same time at the end of 10th year. The details of Y1 and Y2 investment plans are as follows:
Investment Y1: The required investment at present is $27,800.00 which will go through 4 following phases (phase 1 to 4) in next 10 years. At the end of phase 1, 2 and 3 the entire fund will automatically be rolled over to the next phase for re- investment. The investment will mature at the end of phase 4. The 4 phases are as follows:
Phase 1: During first 3 years the investment will earn 12% return p.a. as compounding quarterly, then roll over to phase 2;
Phase 2: In the following 2 years the investment will earn 8% return p.a. simple interest rate method, then roll over to phase 3;
Phase 3: In the following 2 years the investment will earn 14% return p.a. compounding semi-annually, then roll over to phase 4;
Phase 4: The final 3 years of the investment will earn 9% return p.a. compounding annually. The investment matures at the end of phase 4.
Investment Y2: This investment is spread over 3 years. It will commence in the 8th year of the 10 year investment plan, so the timing of this 3 years will match the last 3 years of the 10 years of investment plan of A1. A2 requires an investment of $17,000.00 at the beginning of each month for 3 years, which will earn 6% p.a. return compounding monthly.
Both investments in Y1 and Y2 will mature at the end of the 10th year. How much, in total, will you accumulate from both investment opportunities at the end of 10th year?
Answer the following questions:
- How much each of the package would accumulate at the end of 10th year? Show your calculations.
- Which one of the packages would you accept for your purpose?
(Assume 1
year = 12 months = 52 weeks = 365 days).
Question 2 (Marks 20)
The balance sheet and income statement of Company Z are given below:
Balance Sheet
| Assets | 2016 | 2015 | 2014 | 2013 | 2012 |
| Cash & Equivalents | $336,818 | $319,978 | $313,578 | $310,378 | $303,978 |
| Trade Accounts Receivable | $131,359 | $124,791 | $122,295 | $121,047 | $118,551 |
| Inventory | $11,789 | $11,199 | $10,975 | $10,863 | $10,639 |
| Other Current Assets | $114,518 | $108,793 | $106,617 | $105,529 | $103,353 |
| Total Current Assets | $594,484 | $564,761 | $553,465 | $547,817 | $536,521 |
| Long-Term Investments | $80,836 | $76,795 | $75,259 | $74,491 | $72,955 |
| Net Fixed Assets | $390,709 | $371,174 | $363,750 | $360,038 | $352,614 |
| Intangible Assets | $60,627 | $57,596 | $56,444 | $55,868 | $54,716 |
| Other Non-Current Assets | $77,468 | $73,595 | $72,123 | $71,387 | $69,915 |
| Total Assets | $1,204,124 | $1,143,921 | $1,121,041 | $1,109,601 | $1,086,721 |
| Liabilities | |||||
| Accounts Payable | $27,508 | $26,133 | $25,610 | $25,349 | $24,826 |
| Notes Payable | $74,841 | $71,099 | $69,677 | $68,966 | $67,544 |
| Accrued Liabilities | $363,763 | $345,576 | $338,664 | $335,208 | $328,296 |
| Other taxes Payable | $10,105 | $9,599 | $9,407 | $9,311 | $9,119 |
| Current Portion of Long-Term Debt | $87,573 | $83,194 | $81,530 | $80,698 | $79,034 |
| Total Current Liabilities | $563,790 | $535,602 | $524,889 | $519,532 | $508,820 |
| Long-Term Debt | $333,450 | $316,778 | $310,442 | $276,236 | $270,540 |
| Other Long-Term Liabilities | $77,468 | $73,595 | $72,123 | $71,387 | $69,915 |
| Total Long-Term Liabilities | $410,918 | $390,373 | $382,565 | $347,623 | $340,455 |
| Total Liabilities | $974,708 | $925,975 | $907,454 | $867,156 | $849,275 |
| Share capital | $190,000 | $190,000 | $190,000 | $190,000 | $190,000 |
| Retained Earnings | $39,417 | $27,947 | $23,587 | $52,446 | $47,446 |
| Total Equity | $229,417 | $217,947 | $213,587 | $242,446 | $237,446 |
| Total Liabilities and Equity | $1,204,124 | $1,143,921 | $1,121,041 | $1,109,601 | $1,086,721 |
| No of shares | 50,000 | 50,000 | 50,000 | 50,000 | 50,000 |
Note: Corrected on 28/3/2017. There
was error in the above two lines, I have now corrected them. Sorry for any
inconvenience caused. Please make necessary corrections in your calculations
and solutions.
Income Statement
| 2016 | 2015 | 2014 | 2013 | 2012 | |
| Sales | $1,079,445 | $982,295 | $1,144,212 | $982,491 | $982,334 |
| Cost of goods sold | $464,161 | $481,325 | $537,779 | $628,795 | $609,047 |
| Gross Profit | $615,284 | $500,970 | $606,432 | $353,697 | $373,287 |
| Operating Expenses | $485,750 | $432,210 | $446,243 | $373,347 | $383,110 |
| Operating Profit | $129,533 | $68,761 | $160,190 | -$19,650 | -$9,823 |
| Other Income | $205,095 | $216,105 | $205,958 | $117,899 | $127,703 |
| Other Expenses | $116,040 | $96,265 | $80,667 | $125,759 | $121,809 |
| Earnings Before Interest and Taxes | $218,588 | $188,601 | $285,481 | -$27,510 | -$3,929 |
| Interest Expense | $82,184 | $78,075 | $76,513 | $69,525 | $68,091 |
| Earnings Before Taxes | $136,404 | $110,526 | $208,968 | -$97,034 | -$72,020 |
| Income Taxes@30% | $40,921 | $33,158 | $62,690 | -$29,110 | -$21,606 |
| Net Income | $95,483 | $77,368 | $146,277 | -$67,924 | -$50,414 |
| Additional Information | |||||
| Owners Compensation | $213,730 | $190,172 | $196,347 | $182,940 | $187,724 |
| Depreciation Expense | $97,677 | $92,794 | $90,938 | $90,010 | $88,154 |
| Selling Expenses | $124,070 | $128,658 | $143,748 | $168,077 | $162,798 |
| Lease Expenses | $4,857.50 | $4,322.10 | $4,462.43 | $3,733.47 | $3,831.10 |
Address the following issues in your answers:
Calculate the necessary ratios to analyse (interpret and explain) the performance of company Z over the 5 years period.
Minimum requirements: You should follow the seminar questions on ratio analysis and at least calculate all the ratios shown in the seminar.
Standard expectations: I
would expect you to do research on ratio analysis and performance analysis and
add additional ratios/graphs/charts/trend analysis/pie diagram/or any other
(use all or some of them) to improve your analysis.
Question 3 (Marks 8)
Visit http://www.rba.gov.au/statistics/cash-rate/ to see the record of cash rate changes by RBA. Take the post GFC period (2008 to 2016) and identify the possible reasons for cutting Australian interest rate till today.
Address the following issues in your answers:
- Identify the reasons for cutting interest rate on a continuous basis and keeping it at such low level.
- Show your analysis/calculations to support your reasoning.
Solution.
MAF702 Financial Markets
Question 1
You are making a plan to buy a house after 10 years from today. You are looking for an investment package which will at least produce $750,000.00 at the end of 10th year. There are 2 companies in the market (Company X and Y). Both of the companies are offering you an investment package for your purpose. The details of both of the packages are given below:
Company X offers a package of two investment opportunities X1 and X2 together. If you accept you will have to make separate investments in X1 for 10 years and X2 for 4 years. The investment in X1 should start now, however the investment in X2 will start in 7th year from now. Both investment (X1 and X2) will mature at the same time at the end of 10th year. The details of X1 and X2 investment plans are as follows:
Investment X1: The required investment at present is $65,000.00 which will go through 4 following phases (phase 1 to 4) in next 10 years. At the end of phase 1, 2 and 3 the entire fund will automatically be rolled over to the next phase for re- investment. The investment will mature at the end of phase 4. The 4 phases are as follows:
Phase 1: During first 1 years the investment will earn 12% return p.a. as per simple interest method, then roll over to phase 2;
Simple Interest Formula
Phase 2: In the following 2 years the investment will earn 9% return p.a. compounding daily, then roll over to phase 3;
Compound Interest Formula
Phase 3: In the following 3 years the investment will earn 14% return p.a. compounding monthly, then roll over to phase 4;
Phase 4: The final 4 years of the investment will earn 4% return p.a. compounding quarterly. The investment matures at the end of phase 4.
Investment X2: This investment is spread over 4 years. It will commence in the 7th year of the 10 year investment plan, so the timing of this 4 years will match the last 4 years of the 10 years of investment plan of X1. X2 requires an investment of $4100.00 at the end of each fortnight for 4 years, which will earn 16% p.a. return compounding fortnightly.
Future Value of an Annuity Due Formula
Both investments
in X1 and X2 will mature at the end of the 10th year. How much, in
total, will you accumulate from both investment opportunities at the end of 10th
year?
Company Y offers a package of two investment opportunities Y1 and Y2 together. You will have to make separate investments in Y1 for 10 years and Y2 for 3 years. The investment in Y1 should start now, however the investment in Y2 will start in 8th year from now. Both investment (Y1 and Y2) will mature at the same time at the end of 10th year. The details of Y1 and Y2 investment plans are as follows:
Investment Y1: The required investment at present is $27,800.00 which will go through 4 following phases (phase 1 to 4) in next 10 years. At the end of phase 1, 2 and 3 the entire fund will automatically be rolled over to the next phase for re- investment. The investment will mature at the end of phase 4. The 4 phases are as follows:
Phase 1: During first 3 years the investment will earn 12% return p.a. as compounding quarterly, then roll over to phase 2;
Compound Interest Formula
Phase 2: In the following 2 years the investment will earn 8% return p.a. simple interest rate method, then roll over to phase 3;
Simple Interest Formula
Phase 3: In the following 2 years the investment will earn 14% return p.a. compounding semi-annually, then roll over to phase 4;
Phase 4: The final 3 years of the investment will earn 9% return p.a. compounding annually. The investment matures at the end of phase 4.
Investment Y2: This investment is spread over 3 years. It will commence in the 8th year of the 10 year investment plan, so the timing of this 3 years will match the last 3 years of the 10 years of investment plan of A1. A2 requires an investment of $17,000.00 at the beginning of each month for 3 years, which will earn 6% p.a. return compounding monthly.
Future Value of an Ordinary Annuity Formula
Question 2
Financial ratio analysis
According to Riedl & Srinivasan (2008), ratio analysis is a financial management tool that is used to evaluate the performance of a company in comparison to previous periods or the industry by the use of financial metrics. Financial ratios are classified in five categories i.e. liquidity, profitability, efficiency, activity and solvency ratios. In the section that follows, selected ratios will be calculated and analyzed in order to understand how the company has performed for the last 5 years.
Liquidity
These ratios measure the adequacy of a company to utilize its current and liquid assets to pay off its current or short-term debts. A company’s ability to pay its short-term obligations is also referred to as the solvency or liquidity position. Generally, a company that has sufficient current resources to settle its current obligations if and when they fall due is deemed to have a strong liquidity position. These ratios include current ratio and quick ratio. They are discussed below:
It’s the most popular liquidity ratio, and it measures the ability of the company to meet its current liabilities using the available current assets. Generally, the higher the current ratio, the stronger the position of the company, although it’s generally agreed in finance, that a ratio greater than 1, is sufficient. It is calculated using the formula;
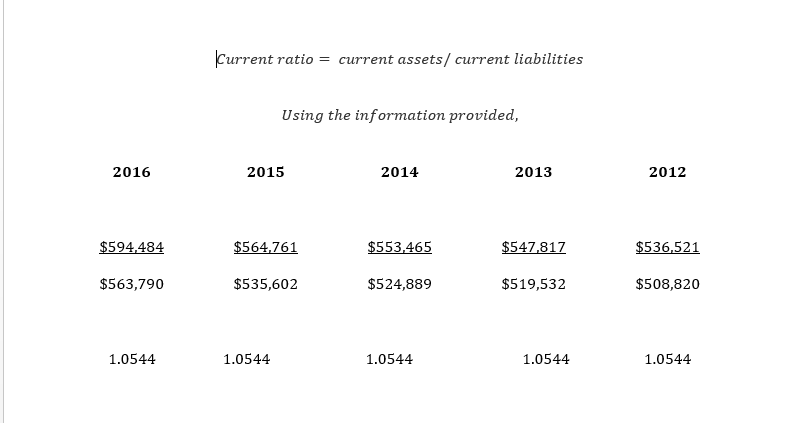
Observation
The current ratio is a modest 1.0544 which has been consistent for the last 5 years
Quick ratio
This ratio seeks to establish the ability of the company to meet its current financial obligations using the most liquid assets. It is calculated using the formula
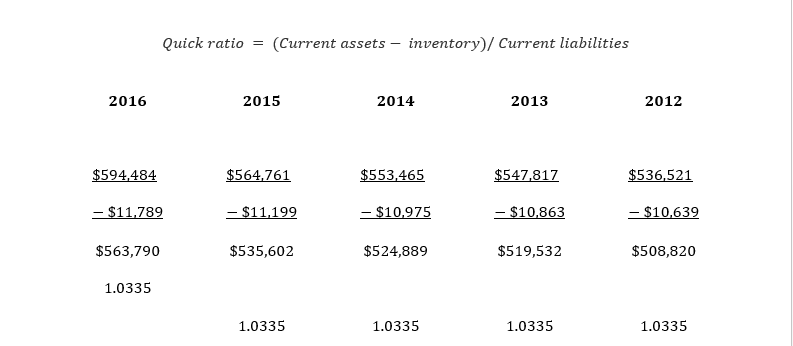
Observation
The quick ratio is 1.0335 which has also been consistent for the last 5 years
Discussion
The company has a current and quick ratio of more than 1, meaning that at any given time, the company has the ability to meet its current liabilities using its current and quick assets. The consistency in the ratios indicates that the company has been stable in performance over the period, and has consistently met its current liabilities as and when they fall due, without resulting in external borrowing.
Profitability ratios
Also known as efficiency ratios, they seek to establish how the company has efficiently employed its resources to generate profits and value for shareholders. They are useful ratios in indicating the success or failure of a business at any given time and are mostly useful against industry averages or in comparison over a period of time. Strong profitability ratios mean that equity owners earn higher dividends, the company is able to repay interests and other fixed charges and that the company has enough resources to take advantage of any available investment opportunities (Sultan, 2014). They include gross profit margins, net profit margin and return on equity among others. These are discussed below.
Gross profit margin
It’s one of the most commonly used financial metrics and it assesses a business’s financial health by revealing the money that is left after the business has accounted for the costs of sales. It’s calculated as
Using the provided data, gross profit margin for the period is
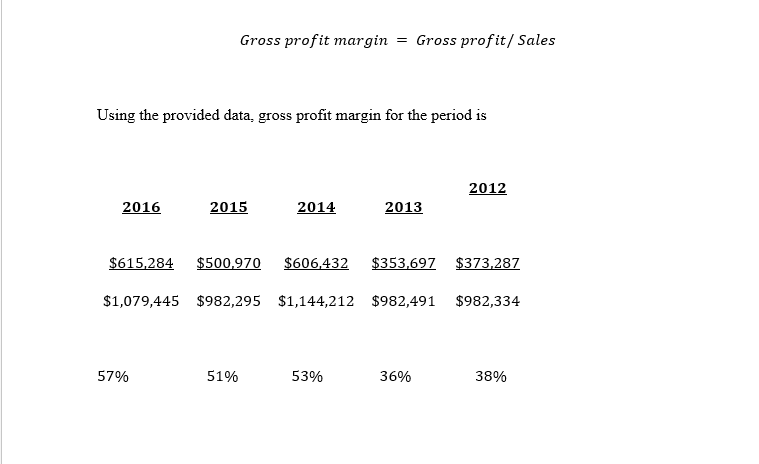
Observation
The gross profit margin has been on an increasing trend, with a low of 36% in 2013, rising to 57% in 2016.
Net profit margin
This is the ratio of net revenues to sales and establishes how much of each dollar received by the company accounted for the business profit. It’s calculated using the formula
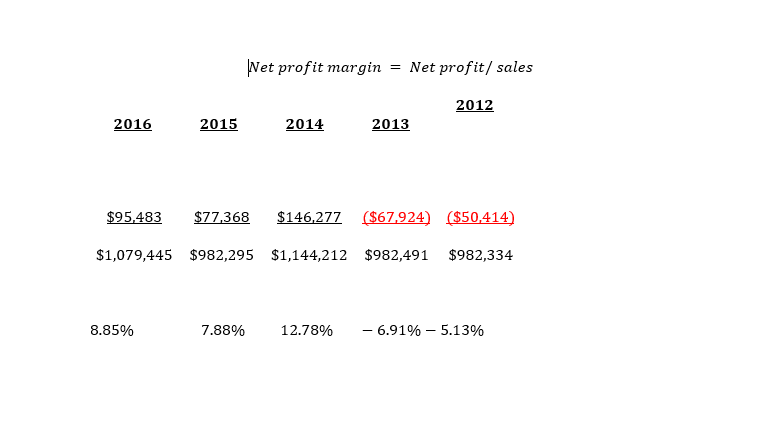
Observation
The company’s net profit mar has been rather unstable, with the company seeing losses in 2012/2013, before stabilizing to post some positive results in the later years.
Return on Equity
Also called the return on net worth, it’s a profitability ratio that measures the number of profit dollars that the company has generated from each dollar of equity. Generally, it measures the efficiency of the company in utilizing shareholders’ funds to generate profit. It’s calculated as
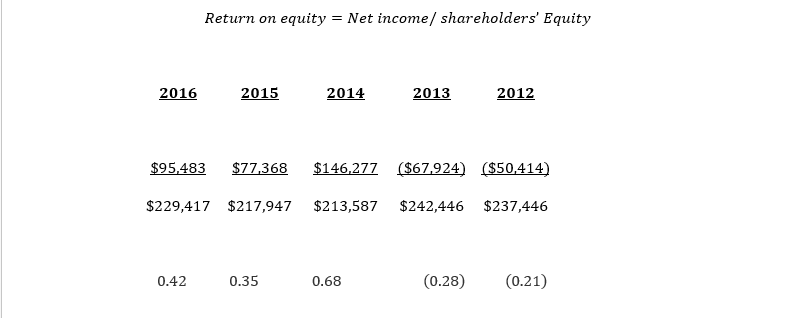
Observation
Just like the net profit margin, the company made losses in the first two years, before picking up between 2014-2016, where the return on equity recorded positive figures.
Discussion
The profitability of the company has been oscillating from a low in 2012 with a high in 2014, although the general trend is that the company is improving its performance. From 2014, the company has continued to post positive returns and has a positive outlook for the following financial periods.
Activity ratios:
Also referred to as turnover ratios, they measure the firm’s efficiency to generate revenues by converting production into revenues and cash. The more efficient the company is, in converting inventory into cash and sales, the higher the profitability of the firm. There are several activity ratios including inventory turnover, working capital turnover, payables turnover, receivables turnover etc. While they are important financial metrics, they are best analyzed in conjunction with other parameters such as liquidity ratios in a timely or industry set up. We shall discuss inventory turnover ratios.
Inventory turnover
Inventory turnover ratio seeks to establish how efficiently the company manages its inventory to generate sales. It measures how many times inventory is sold and replaced over a period of time. It is calculated using the formula
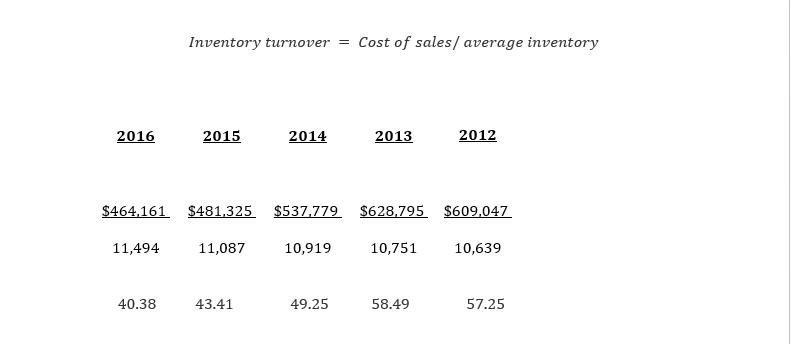
Observation
The inventory turnover has deteriorated over time, from a high of 58.49 times in 2013 to a low of 40.38 times in 2016.
Solvency ratios
These are very important financial ratios that measure the stability of a company, with regard to its ability to survive for a long time as a going concern. They relate to the company’s capital structure, the ability of the company to repay interests on borrowings and the proportion of debt and equity in the company’s capital structure. We shall discuss the debt/equity ratio, the times’ interest earned and the debt ratio.
As a measure of a company’s financial leverage, this ratio measures how much a company is using debt to finance its assets as compared to those that are financed using the shareholder’s equity. It’s calculated as
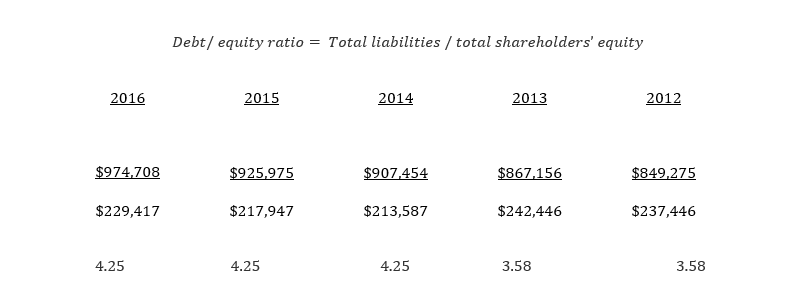
Observation
The company’s use of debt to finance its operations relative to equity has been stable for the period, increasing slightly from 3.58 times in 2012/2013 to 4.25 times from 2014 through to 2016.
Debt ratio
This ratio expresses the percentage of assets that are financed through debt financing and is calculated as:
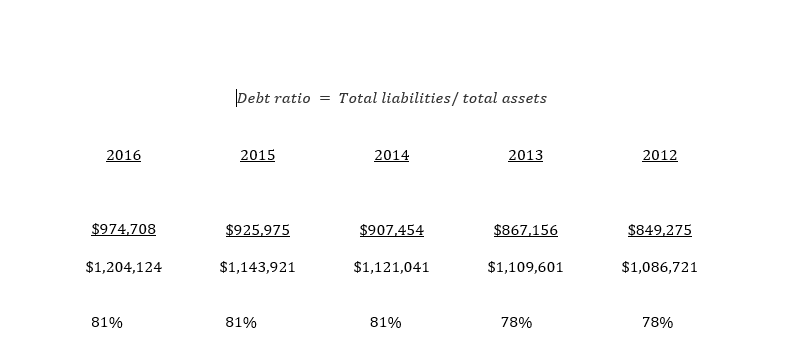
Observation
The company’s debt ratio has been stable, rising slightly from 78% in 2013 to 81% for the next three years.
Interest coverage ratio
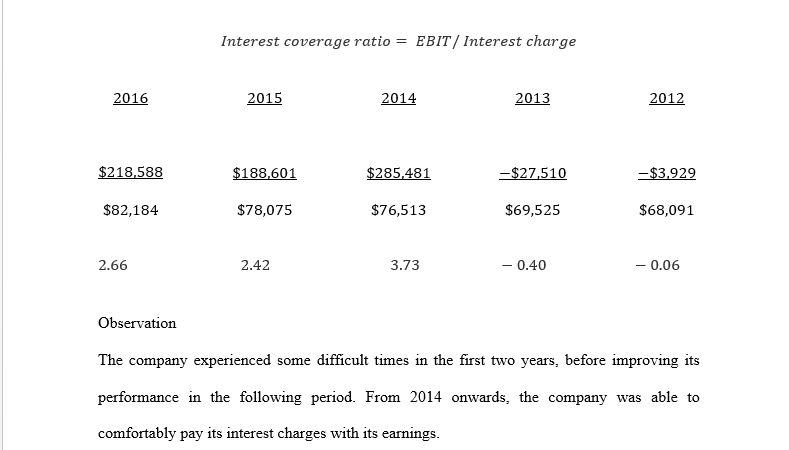
This metric measures the ability of the company to repay interest on fixed debts such as loans and leases from its earnings. It’s calculated as
Observation
The company experienced some difficult times in the first two years, before improving its performance in the following period. From 2014 onwards, the company was able to comfortably pay its interest charges with its earnings.
Discussion
While the company has continued to leverage its performance on the use of debt as opposed to equity, with high gearing ratios even financing its assets to the tune of 81% through debt, it has continued to improve its performance for the period, and for the last three years (2014-2016), was able to maximize on the use of debt to generate enough resources to cover its interest charges.
Question 3
Reasons for cutting the cash rate in Australia
The role of the reserve bank of Australia (RBA) has, for many years been to ensure the “economic prosperity and welfare of the people of Australia.” To do this, the bank employs a set of monetary and fiscal policies, aimed at enhancing the stability of the Australian currency, maintaining full employment and enhancing the welfare and economic prosperity of the Australian people. Depending on how much money is in circulation, the bank may alter the cash rate either to boost demand or to cap national spending. This is done after considering factors such as the international economic climate in terms of currency, housing and consumer demand in countries such as the United States, China, and the European Union nations; domestic factors such as unemployment, demand, inflation, consumer and business confidence; the stability of the Australian financial markets and the impact of the previous monetary policy actions.
In the last couple of years, Australia has witnessed a depressed economic growth, moderate unemployment, low demand, wages and inflation. This has negatively affected the other macroeconomic variables, demanding the RBA to take action to remedy the situation. In order to reverse this trend, the RBA, through its monetary policies has relied on the cash rates to encourage the increase lending by financial institutions, increase disposable income, increase demand, inflation and interest rates. These variables would then increase investments and consequently spur economic growth. For the last couple of years, the RBA, in its monetary policies has consistently reduced the cash rates, from a high of 7.25 in 2008 to a low of 1.5 in 2016. The cash rate is the percentage of total banking liquidity that is kept by the country’s central bank, and is a monetary tool that the reserve bank uses to influence the amount of money in circulation, as its affects various macroeconomic elements such as inflation, unemployment, interest rates and demand and economic growth. Economic scholars have fronted various arguments for the continued reduction of the cash rate by the RBA. These are discussed below.
To spur business invest and economic growth
The current low levels of business investment continue to inform policy makers to try to stimulate investments which are deemed to be key ingredients for long term growth in productivity, employment and wages. Reducing the cash rate means that banks have more resources to lend out to businesses, which encourages investments. A lower cash rate also translates to lower interest rates which discourages savings and encourages borrowing and investments, consequently spurring economic growth. It’s therefore safe to argue that reduced cash rates are a sure way to encourage borrowing, spur investment, employment and economic growth.
To attain targeted inflation
According to Bosworth (2014), there is a tradeoff between unemployment, interest rates and inflation. Currently, the inflation level in Australia is at a low of 1% while the RBA targeted rate in order to create adequate demand is 2-3% at least over the medium term. In May 2016 for instance, the RBA forecasted inflation rate was revised from 2.5% to 1.5% with projections indicating that it would continue to decline for the next couple of years. It has to be remembered that low inflation has negative consequences on the economy such as reduced demand and unemployment. In order to stimulate demand and attain the targeted inflation figures, RBA continues to reduce the cash rates so as to encourage both business and personal borrowing and increase inflation to a level that can support adequate demand. The consequences of deflation, which include reduced demand, increased unemployment, and lower wages and suppressed economic growth would be detrimental to the economy, thus occasioning the need for monetary policy measures to reverse the process.
Impact on savings
The decision to cut cash rates to a record low may also be informed by the desire to encourage businesses and individuals to reduce their savings and invest their funds in riskier assets that yield higher returns. Low interest rates are known to suppress savings, as businesses and households earn less in fixed deposit accounts, as they would in other investments. Reduced savings means that there is more disposable income, which stimulates demand, increases inflation, employment rates and spurs economic growth.
Rates in the regional markets
As noted above, the decision to influence the cash rates is pegged on a number of factors, among them the prevailing rates in the regional markets such as the US, Europe and China. According to Kent (2015),the low cash rates in Australia are still relatively attractive given the low rates, and in some extreme cases, negative rates in Europe. This means that even after reducing the cash rates to spur economic growth, reduce unemployment and increase demand, Australia still remains an attractive investment destination compared to other regional nations.
Encouraging exports
Reduced cash rates by the RBA leads to a reduction in the value of the Australian currency, and therefore makes the Australian exports more attractive while imports become more expensive. This not only encourages investment and exports, but also increases the aggregate demand resulting from the exports which spurs investment and economic growth.
References
Sultan, A.S (2014) Financial Statements Analysis – Measurement of Performance and Profitability: Applied Study of Baghdad Soft-Drink Industry. Research Journal of Finance and Accounting www.iiste.org ISSN 2222-1697 (Paper) ISSN 2222-2847 (Online)
Riedl, E,J & Srinivasan, S (2008) Signaling Firm Performance Through Financial Statement Presentation: An Analysis Using Special Items. http://www.hbs.edu/faculty/Publication%20Files/09-031_14dc7ae0-dbdd-47c5-868f-dbbaa8605360.pdf
Kent,C (2015) Australian Economic Growth – The How, What and Where. Retrieved from: http://www.rba.gov.au/speeches/2015/sp-ag-2015-03-11.html
Bosworth,P.B (2014) Interest rates and economic growth: are they related? http://crr.bc.edu/wp-content/uploads/2014/05/wp_2014-8.pdf

