UK and European Economy
INSTRUCTIONS:-
Part1
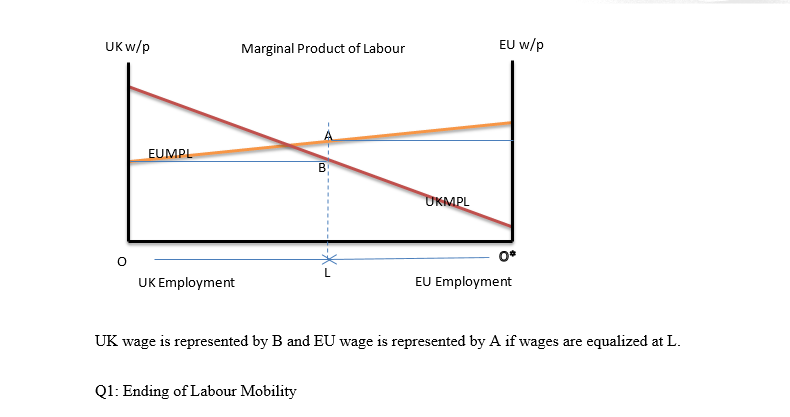
Draw a diagram of the combined UK & European economy along the lines of lecture 8, with the UK labour force read from the left (increasing as you go left to right). The UK currently has around 3 million EU residents living inside its borders, and around 1 million Britons live in the EU, so on balance you can treat the initial equilibrium as one where a restriction of labour mobility would result in a net transfer of workers from the UK to the EU. Mark clearly the UK and European wage in an initial neoclassical equilibrium and the labour allocations if wages are equalized between the UK and the EU.
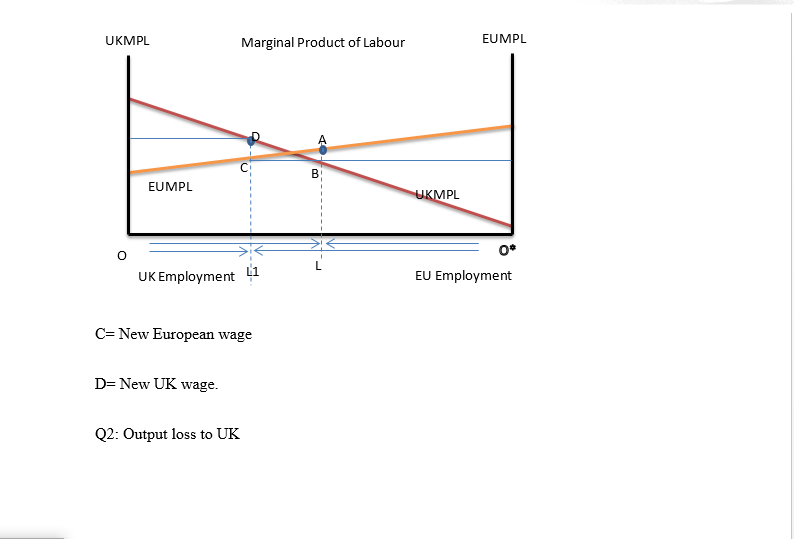
Q1 (1 mark) Suppose Brexit is confined to an ending of labour mobility between Britain and the EU. Show the new UK wage and the new European wage on your diagram.
Q2 (1 mark) Show the output loss to the UK. You may assume that workers in the UK prior to the end of labour mobility count for the UK.
Q3 (4 marks) Do a welfare analysis of the policy for capitalists and workers in the UK and Europe. You may measure worker welfare as the wage and not total compensation to workers.
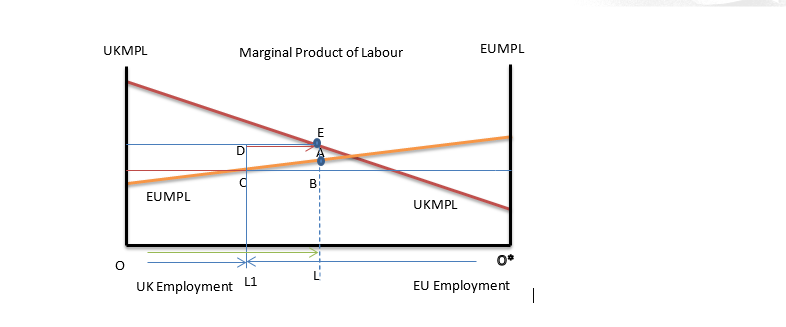
Q4 (1 mark) Suppose a US-UK trade deal leads to a capital inflow into the UK, which you can treat as an increase in the UK specific factor. Show on your diagram how much the productivity of UK workers would have to rise by to counteract the losses of Q3. You will need to set two areas equal to each other in your diagram to illustrate this.
Q5 (1 mark) Compare the post Brexit situation prior to a capital inflow with the situation after the capital inflow (holding the workers in the UK fixed) and do a welfare analysis on UK workers and capitalists. Who benefits from the capital inflow? What is it about this model that makes this happen and what political or institutional factors might lead to a different result?
Part2
The recent growth of the US energy sector has been staggering. In 2006 60% of US energy was imported, but now the figure is only 36%. Two very different US policies proposed by the Trump administration – an aggressive fiscal expansion and a releasing of energy exports from environmental controls – have very similar macroeconomic effects. This question is about the inter-relationships between these policies and any environmental policies remaining in place.
Q1 (2 mark) Using the Mundell-Fleming model of lecture 6 show the short run and long run impact of a US fiscal expansion (hint: you do not need to consider the inflationary impact – you can assume a US fiscal expansion (hint: you do not need to consider the inflationary impact – you can assume trade flows adjust before inflationary pressure emerges). Make sure you write out the national income identity with the long run effects underneath.
Q2 (2 marks) Using the Mundell-Fleming model of lecture 6 show the short run and long run impact of an autonomous increase in US energy exports due to the abandoning of many environmental regulations on energy exploration and exporting (hint: you do not need to consider the inflationary impact – you can assume trade flows adjust before inflationary pressure emerges). Make sure you write out the national income identity with the long run effects underneath.
Q3 (2 marks) carefully compare the long run equilibria of Q1 and Q2. In each case, describe any crowding out that is occurring.
Q4 (2 marks) Suppose any environmental degradation arising from the US consumption of energy was subject to a Pigovian tax (a tax on consumption where the tax paid fully covered the environmental damage). Starting from an initial macroeconomic equilibrium at full employment output, trace out the short run and long run adjustment to this tax. Be sure to include the national income identity with long run effects beneath.
Solution
UK and European Economy
Part 1: UK and European Economy


The output for UK will reduce from OL to OL1 due to a reduction in the number of employees as labour mobility ends.
Q3: Welfare Analysis
When there is freedom in the mobility of labour, workers can seek employment in the regions where there is a higher wage rate. When UK has high wage rates, workers will migrate to UK to seek better livelihoods. The migration will in turn lead to a reduction in the labour force in the European region and the capitalists will have to increase the wage rates to retain the remaining workers. As a result, the workers will enjoy higher pays but the capitalists will incur larger expenses and get reduced outputs.
The capitalists in the UK will get more employees and their outputs will increase. They will also reduce the wage rate. As a consequence, the Britons and other UK workers will be adversely affected because they will receive less pay as compared to what they were getting before the migration.
When the mobility of labour is stopped, the process is reversed as the UK residents enjoy more pay but the capitalists experience lower outputs. Outputs increase in the EU but the wages again decline so that the capitalists benefit but the workers do not.
Q4: Capital Inflow

With a US-UK trade deal that ensures that there is cash inflow into the UK, the workers in the UK will get paid more, thereby boosting their productivity. The productivity of the UK workers would have to double to get back to OL indicated by the green arrow.
Q5: Comparison of Brexit situation pre and post the cash inflow
Before the cash inflow, the workers earned low wages at D and their productivity was low at OL4. When the cash inflow into UK was introduced, the same number of workers got paid more, but their productivity had to double to compensate for the loss in workers due to the end of labour mobility between Britain and EU. The workers benefit by earning increased wages. However, the capitalists place upon them requirements that they should work harder to attain the required level of productivity. Before the inflow, the capitalists only benefitted slightly. With the cash inflow, the capitalists benefitted both in terms of income and increased output.
Part 2

